


Power BI is now one of the most popular business intelligence software tools for transforming data into valuable information. However, even the best dashboard visualization tool will bring mediocre results if the dashboards are poorly designed or the underlying database is not optimized. Implementing Power BI best practices will help the company achieve improved report quality, faster report production, increased user adoption, and scalable analytics solutions.
Regardless of the task at hand, whether designing an executive dashboard and report or an enterprise business intelligence solution, following Microsoft Power BI best practices will make the created solutions more performant, easier to maintain, and accelerate business processes’ decision-making.
Why Are Power BI Best Practices Important?
Many organizations adopt Microsoft Power BI expecting immediate results, but effective dashboards require proper planning, data modeling, and ongoing optimization. Power BI reports are often slow to load, dashboards are not in sync, data sets are duplicated, and many other issues arise. Usually, none of these defects originate from the technology; rather, it’s the poorly designed dashboards, inefficiently structured data models, or development practices that vary that are to blame for such problems.
Power BI dashboard best practices, if followed closely, allow companies to:
- Boost the performance of the dashboards and make the reports more responsive
- Use the same style and create visuals that users will enjoy interacting with
- Minimize effort for updates and get rid of unnecessary technical elements
- Harden data management and protect the data
- Facilitate a working atmosphere wherein team sharing is encouraged between teams
- Enable faster analysis and help businesses respond quickly to changing conditions.
A structured approach allows companies to get the most out of data analytics with Microsoft Power BI and, in parallel, ensure that decision-makers get trusted and actionable insights.
Top 10 Power BI Best Practices
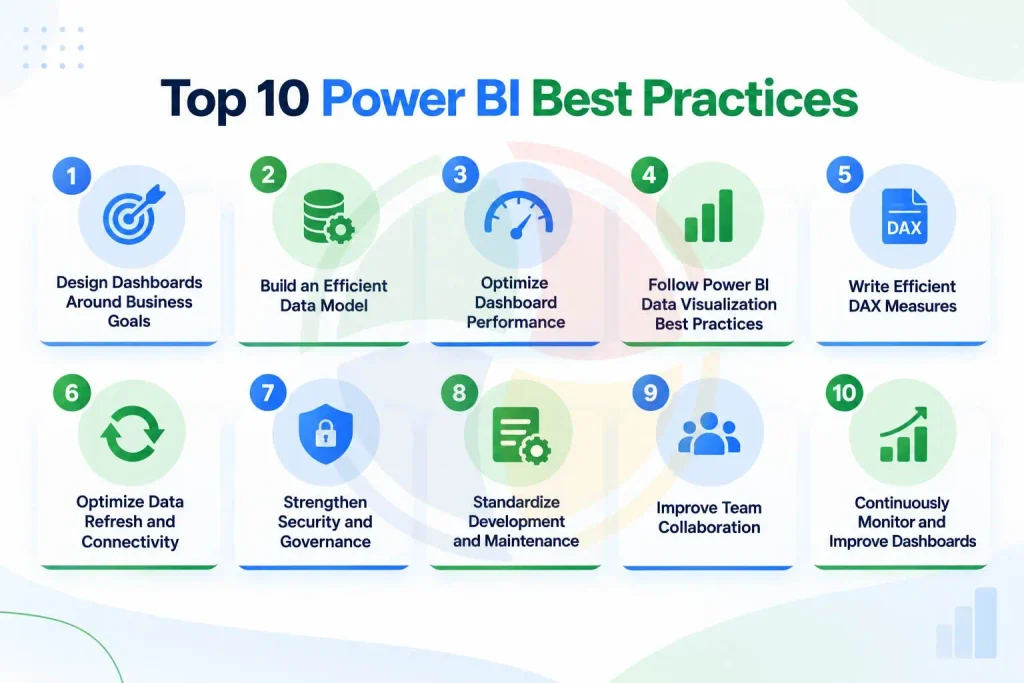
1. Design Dashboards Around Business Goals
Every great Microsoft Power BI dashboard should prioritize understanding for the target user. Rather than adding a large number of diagrams and pictures to the report, think only about the essential business issues that need to be addressed at this stage.
Features such as an efficient dashboard layout include:
- Serving the most vital performance indicators at a glance
- Keeping a set of similar indicators together in one block
- Having a standard look of color and formatting throughout the dashboard
- A void of confusion with well-chosen titles and labels
- A sparse number of graphics to reduce cognitive overload
- User-friendly desktop and mobile interface
2. Build an Efficient Data Model
The basis of an efficient Power BI report is a data model that is well built. With well-constructed datasets, not only will reports be created faster, but report maintenance will be much easier as well.
Microsoft Power BI data modeling best practices include the following:
- Go for a star schema as much as you can.
- Fact and dimension tables should each be in their own table.
- Don’t include columns just because they are there if they are not going to be used.
- Determine relationships carefully to avoid making them highly complex.
- If you can help it, many-to-many relationships should not be the ones you resort to in most cases.
- Selecting the right data types not only makes the database more efficient but also reduces the file size.
3. Optimize Dashboard Performance
You should start thinking about report speed well before dashboards are even being developed.
Power BI performance optimization is best done through:
- Minimizing the amount of data.
- Using an incremental refresh.
- Query folding, when it is possible.
- Efficient use of the DAX language features.
- Deleting unnecessary tables and fields that have been removed from the model.
- If possible, reduce the number of user interaction elements.
- Try to refrain from having too many slicers and other visuals on the one view or page.
You can use Microsoft‘s built-in Performance Analyzer tool and external ones like DAX Studio to find what is causing a dashboard to slow down.
4. Follow Power BI Data Visualization Best Practices
Well-designed dashboards offer users quick access to the information they need without overwhelming them with unnecessary details. Each visualization has to be an answer to a particular business question and not just a data display.
When building your Power BI reports, make sure to follow these guidelines:
- Design charts according to the metric type
- Use colors consistently across all slides
- Use only 3D charts when necessary
- Draw attention to the trends and the outliers
- Tidy your layouts by making efficient use of whitespace
- Don’t use numerous different colors
- Guarantee the visibility of your visuals by applying legible fonts and strong color contrast.
5. Write Efficient DAX Measures
If your DAX formulas are written in poor style, it can slow down your reports. Organized DAX helps reports be debugged, optimized, and extended.
DAX Best Practices:
- Develop reusable measures
- Leverage variables (VARs) to simplify your math;
- Use calculated columns only when necessary and prefer measures for dynamic calculations where appropriate.
- Minimize the number of nested IFs;
- Choose a naming pattern and stick to it;
- Leave the calculation as a small and easy-to-maintain one.
6. Optimize Data Refresh and Connectivity
Getting the right storage setup to work with your report engine will allow you a good chance of striking the perfect trade-off between report speed and your access to up-to-the-minute data.
The main things that should be on top if you are making a decision are listed below:
- We recommend using Import Mode for the most efficient report speed
- DirectQuery is the one that needs to be used if your reporting is to be in real time
- Enable Incremental Refresh on datasets that are of large sizes
- Refreshes should be set to happen during off-peak hours
- Import only the data required for reporting to reduce dataset size and improve performance.
Coming up with a sound storage strategy will greatly enhance Power BI performance while minimizing processing time.
In the Power BI universe, getting data is a process, refreshing a dataset is a process in itself, and refreshing only the newest or the changed data is much more efficient compared to refreshing the whole dataset.
7. Strengthen Security and Governance
Business intelligence (BI) applications usually have valuable information about the company’s day-to-day operations and financials. Therefore, security has to be one of its main features.
Besides the basic security features, the following are the most important security strategies:
- Activate Row-level Security (RLS).
- Workspace permissions are a very delicate matter, so manage them well.
- Categorize confidential data sets.
- Use appropriate Microsoft labeling when needed.
- Determine the sharing policy for the reports.
- Review the workspace access periodically.
Effective governance means that only authorized users are able to access information that is relevant to their roles.
8. Standardize Development and Maintenance
When companies expand their data analytics setup, one thing that gets harder to manage is consistency.
Long-term sustainability will increase if you:
- Use the same way of labelling things as a general rule
- Explain how and why data is used for business decisions
- Share semantic models
- Follow the same approach for arranging your workspaces
- Remove outdated reports from circulation
- Maintain development, test, and production environments in sync
Following the established Power BI dashboard best practices can significantly reduce technical debt by ensuring easier updates and modifications in the future.
9. Improve Team Collaboration
Collaboration between stakeholders such as business users, analysts, and developers is fundamental to successful analytical endeavors.
This collaboration is facilitated by various features in Microsoft Power BI:
- Workspaces
- Deployment pipelines
- Semantic models
- Apps
- Microsoft Teams integration
- Version control processes
Data sharing guarantees that each department uses the same trusted source for their reports.
10. Continuously Monitor and Improve Dashboards
Power BI optimization should be an ongoing process as data volumes and business requirements change. As the business needs transform and the amount of data grows, dashboards must be analyzed and updated from time to time.
You need to analyse:
- Who opens the reports and how often they are seen
- Results from Performance Analyzer
- Queries that run the slowest
- Time spent on refreshing a dataset;
- Listening to feedback;
- Unused reports and graphics.
Through consistent optimization, you get to maintain high speed, precision, and dashboard content that reflects business changes.
Conclusion
Adopting Power BI best practices can help the organization create dashboards that are not only fast, but also easy to keep up with and better at presenting information for people to take action. Everything from making a user-friendly Microsoft Power BI Dashboard to speeding up your reports, plus the ways to enhance the Power BI Data Visualization feature, every single best practice is a step in the right direction for making better business decisions and developing a well-thought-out analytics strategy.
Whether you need custom Power BI dashboards, enterprise reporting, performance optimization, or dedicated Microsoft Power BI developers, Aegis Softtech helps organizations build secure, scalable, and high-performing analytics solutions tailored to their business goals.
Frequently Asked Questions
1. What are the recommended Power BI dashboard best practices?
Power BI dashboard best practices include user-focused layouts, prioritizing key KPIs, consistent formatting, optimized data models, fewer unnecessary visuals, Row-Level Security (RLS), and regular performance monitoring.
2. Are there ways that I can increase Power BI performance?
Yes. Improve Power BI performance by using a star schema, reducing data size, enabling Incremental Refresh, optimizing DAX, limiting visual interactions, and removing unnecessary columns and tables. Performance Analyzer can also help identify slow visuals and queries.
3. What is the best data model to use with Microsoft Power BI?
A star schema is generally recommended for Power BI. It simplifies data relationships, improves query performance, reduces complexity, and makes reports easier to maintain and scale.
4. What are the most important practices in Power BI data visualization?
Key Power BI data visualization practices include choosing the right charts, using consistent colors, avoiding unnecessary elements, highlighting key insights, and aligning every visual with business goals. Effective visuals should make data easier to understand, analyze, and use for decision-making.
5. At what level should the Power BI dashboards be optimized?
Power BI dashboards should be reviewed regularly and whenever datasets, reporting structures, or business requirements change. Regular optimization helps maintain performance, accuracy, and usability.