

Microsoft Fabric and Power BI serve different but connected purposes. Power BI focuses on business intelligence, reporting, and visualization. Microsoft Fabric, on the other hand, covers the broader analytics platform around it, including data integration, engineering, warehousing, data science, real-time intelligence, and Power BI itself.
This Microsoft Fabric vs Power BI comparison explains their key differences in architecture, storage, processing, analytics, governance, pricing, and use cases.
Microsoft Fabric vs Power BI: Key Differences at a Glance
| Basis | Microsoft Fabric | Power BI |
| Purpose | Unified, end-to-end analytics platform for all data roles | Business Intelligence tool for visualization and reporting |
| Data Storage | OneLake (unified data lake, Delta-Parquet format) | Primarily in-memory datasets (VertiPaq engine) |
| Data Processing Capabilities | Full spectrum: Data engineering (Spark), ETL (Data Factory), Data Warehousing (SQL), Real-time analytics, Data Science | Data preparation/modeling: Power Query for ETL, DAX for calculations |
| Analytics and Reporting | Integrated BI via Power BI | Interactive reports, dashboards, and visualizations |
| Architecture | Unified, SaaS-based, lake-centric (single compute/storage) | Client-server and cloud (SaaS) |
| Integration | Deeply integrated Microsoft services, open format for others | Hundreds of connectors to various data sources (Microsoft & third-party) |
| Security and Governance | Centralized across all data items in OneLake (Purview, Entra ID) | Robust for reports/datasets (RLS, OLS, Entra ID) |
| Pricing | Capacity-based | User-based or capacity-based |
| AI and Advanced Analytics | Copilot, full ML lifecycle, real-time AI | AI visuals, AutoML, Azure ML integration |
| Use Cases | Building unified data platforms, breaking silos, and streaming analytics | Creating dashboards, ad-hoc analysis, and sharing business insights |
What is Microsoft Fabric?
Microsoft Fabric is an integrated, AI-driven suite of services and tools. Built on OneLake, Microsoft’s multi-cloud data lake, it is a data management platform, offering a Software-as-a-Service (SaaS) experience. You can seamlessly manage, visualize, and analyze your data with Fabric.
It encompasses seven core workloads, namely Data Science, Data Warehousing, Data Factory, Data Activator, Real-Time Analytics, Data Engineering, and Power BI. With all necessary tools under a single roof, it facilitates better communication and decision-making across different business units.
What is Power BI?
Power BI is a self-service enterprise business intelligence platform by Microsoft. For a business user, that translates into user-friendly interfaces and tools for data reporting, aggregation, visualization, and analysis, with a real-time view of business data through interactive Power BI dashboards — making insight sharing and collaboration far more seamless.
It is a popular data visualization tool that helps transform data into intuitive dashboards and reports for immersive insights. For a team pulling from SQL servers, Excel, or Azure, that translates into raw data becoming engaging and accessible without extra work on their end.
Microsoft Fabric vs Power BI: Detailed Comparison
The difference between Microsoft Fabric and Power BI becomes clearer when comparing how each platform handles data storage, processing, analytics, architecture, security, AI, and other enterprise requirements.
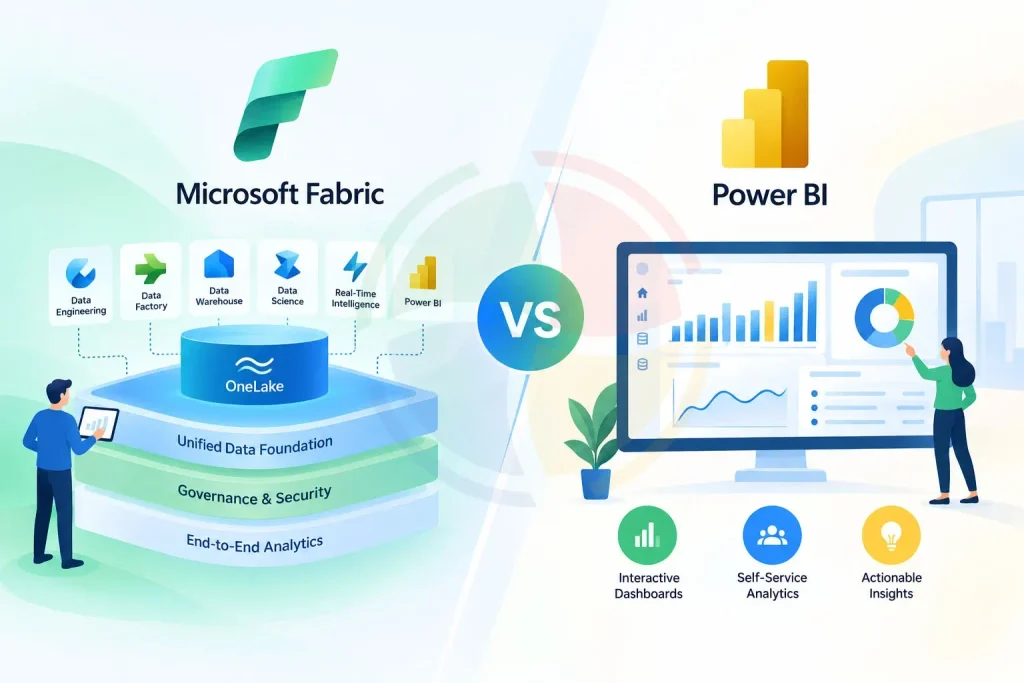
Let’s dive into a Microsoft Fabric vs Power BI comparison.
Primary Purpose
- Power BI: It is a business intelligence tool built around interactive dashboards, reporting, and visualization. Connect it to a data source, and it turns raw numbers into something a business can actually act on, not just look at.
- Microsoft Fabric: It is a unified analytics platform for the entire data lifecycle. Its key purpose encompasses data engineering, warehousing, science, BI, real-time analytics — all under one platform instead of five separate tools. That’s what actually eliminates data silos, not a promise to “integrate better.”
Data Storage
- Power BI: It has two main modes for data storage. First is the import mode. The data is loaded into the platform’s in-memory engine (VertiPaq) as a compressed columnar database. Second is DirectQuery/Live Connection. The data resides in the source system, and it directly sends queries.
- Microsoft Fabric: It introduces OneLake as the unified, logical data lake for your organization. All data from Warehouses, Lakehouses, KQL Databases, etc., is stored in Delta Parquet format on OneLake. It simplifies governance, makes data readily accessible, and eliminates data duplication.
Data Processing Capabilities
- Power BI: It uses Power Query (or the M language) for Extract, Transform, Load (ETL) operations on source data, resulting in robust data processing. While it cleans, shapes, and combines data for BI models, its processing capabilities are not fit for large-scale data engineering.
- Microsoft Fabric: You can use its rich suite of data processing capabilities for complex ETL/ELT across various data scales and types. The most common ones are Data Factory (for data integration pipelines), Data Warehousing (SQL engine for processing structured data), and Data Engineering (Spark notebooks for large-scale data transformations).
Analytics and Reporting
- Power BI: It offers Power BI Desktop, a highly intuitive desktop application for report authoring, and a cloud service for consumption, sharing, and collaboration. For a user working with complex data, that translates into interactive reports, dashboards, and rich visualizations that make it easier to understand.
- Microsoft Fabric: Fabric not only integrates Power BI’s reporting capabilities but also extends analytics further. For a team needing more than reporting, that translates into Real-Time Analytics for streaming data analysis, Data Warehousing for traditional SQL-based analytical queries, and Data Science for developing and deploying ML models — all under the same platform.
Architecture
- Power BI: It operates mainly on a client-server architecture. Power BI Service manages publishing, consumption, and sharing. Power BI Desktop works as the client-side tool for modeling and authoring. You can either import the data models into Power BI’s VertiPaq in-memory engine or access them directly from source systems.
- Microsoft Fabric: Its unified SaaS architecture is built on a single, shared foundation, with OneLake as the central data store. All its workloads offer distinct experiences and use common metadata and governance.
Integration
- Power BI: It connects with hundreds of data sources, including Microsoft services, databases, cloud platforms, and third-party applications. For a team pulling from different systems, that translates into bringing data into Power BI for modeling, analysis, and visualization without changing the underlying source systems.
- Microsoft Fabric: It provides deeper integration across the entire data lifecycle through its unified platform. For an organization running multiple workloads, that translates into Data Factory, Data Engineering, Data Warehouse, Data Science, Real-Time Intelligence, and Power BI working with the same data foundation in OneLake, reducing the need to move data between separate tools and environments.
Security and Governance
- Power BI: It covers security and governance across reports, dashboards, semantic models, and datasets. Row-Level Security, Object-Level Security, Microsoft Entra ID, workspace permissions — that’s what actually controls who sees what, down to specific rows and objects, not just who’s allowed to log in.
- Microsoft Fabric: It extends governance across the broader analytics environment. With OneLake providing a common data foundation, organizations can apply security, access controls, and governance across different data items and workloads using capabilities such as Microsoft Purview and Microsoft Entra ID.
Pricing
- Power BI: Primarily uses per-user licensing for creating, sharing, and consuming reports, with capacity-based options available for organizations that need dedicated resources and broader distribution.
- Microsoft Fabric: Primarily uses capacity-based pricing, where shared compute capacity supports multiple workloads, including data engineering, data warehousing, data science, real-time analytics, and Power BI. This allows organizations to allocate capacity across workloads rather than purchasing separate compute for each one.
AI and Advanced Analytics
- Power BI: Uses AI to make business reporting and data exploration easier. Common capabilities include Copilot-assisted analysis, natural language queries, AI-powered visuals, anomaly detection, and integration with machine learning models.
- Microsoft Fabric: Supports AI and advanced analytics across the wider data lifecycle. Organizations can prepare data, build and train machine learning models with Data Science, use Copilot across supported Fabric experiences, and analyze streaming data through Real-Time Intelligence.
Use Cases
- Power BI: Best suited for dashboarding, reporting, KPI tracking, and self-service business analytics. Common use cases include sales performance dashboards, financial reporting, marketing analysis, operational reporting, executive dashboards, and departmental analytics.
- Microsoft Fabric: Designed for end-to-end data and analytics workloads that go beyond reporting. Common use cases include integrating data from multiple sources, building data pipelines and lakehouses, enterprise data warehousing, real-time analytics, machine learning and data science, and delivering Power BI reporting from the same data platform.
Making the Right Choice for Your Data Needs
The right choice really comes down to the scope of your data and analytics needs.
- Go with Power BI if what you’re mainly after is business intelligence — dashboards, reporting, KPI tracking, self-service data analysis, that sort of thing.
- Go with Microsoft Fabric if you need something broader — a platform that brings together data integration, engineering, warehousing, data science, real-time analytics, and BI all in one place.
You can also use both together. Power BI is a core Fabric workload, allowing organizations to extend their existing BI capabilities across a broader data and analytics environment.
Aegis Softtech can help you assess your requirements and determine the right approach with Microsoft Fabric consulting services.
Frequently Asked Questions
Q1. Is Fabric replacing Power BI?
Microsoft Fabric is not replacing Power BI. Instead, Power BI is an aspect of the Fabric environment.
Q2. Is Microsoft Fabric needed for Power BI?
No, you do not need Microsoft Fabric to use Power BI. It can be used as a standalone tool for data visualization and reporting.
Q3. Does Microsoft Fabric use DAX?
Yes, Microsoft Fabric does use DAX (Data Analysis Expressions) within its Power BI workload.
Q4. Can Microsoft Fabric and Power BI be used together?
Yes – Power BI runs as one of Fabric’s core workloads, pulling directly from OneLake, Warehouses, and Lakehouses for reporting and visualization instead of a separate data pull.
Q5. Which organizations can benefit from Microsoft Fabric?
Data engineering, warehousing, data science, real-time analytics, BI – the more of these an organization is juggling separately, the more Fabric actually helps by bringing them onto one platform.
Q6. Can Power BI connect to Microsoft Fabric data?
Yes. Power BI can consume data from Fabric’s unified data environment, including OneLake and its associated Warehouses, Lakehouses, and other data items.