


Two tools dominate the enterprise analytics market in 2026. The Microsoft Power BI vs Tableau debate is one every BI team faces. Power BI is for organizations running Microsoft 365, Azure, or Dynamics 365 and offers governed reporting at $14/user/month. Tableau suits Salesforce teams needing visual depth and exploratory flexibility. The right choice depends on your data, users, and existing technology stack.
What Is a Data Visualization Tool and Why Does This Comparison Matter?
Data visualization tools turn data into charts, dashboards, and reports that business teams can read and act on, no SQL required. Power BI and Tableau are the two leading data visualization tools in 2026.
Businesses compare them because BI platform decisions carry long-term cost and architecture implications. Choosing the wrong tool creates integration debt and retraining costs that surface two or three years in, not on day one.
Both platforms now include AI-assisted analytics, self-service reporting, and enterprise governance, making the evaluation more nuanced than a simple price comparison. Our Power BI dashboard development team helps organizations get maximum value from whichever platform they choose.
Microsoft Power BI vs Tableau: What’s Different Across Key Business Factors?
Both platforms handle core BI needs well. Where they differ is architecture, ecosystem fit, Power BI vs Tableau performance under scale, and total cost of ownership. Here is the full Microsoft Power BI Comparison across every decision-relevant factor:
| Comparison Area | Microsoft Power BI | Tableau |
| Ease of use | High; Excel-like interface, familiar to Microsoft users | Moderate; intuitive drag-and-drop, but more options to navigate |
| Learning curve | Gentle for beginners, steeper for DAX mastery | Moderate to steep; LOD expressions require analytical thinking |
| Data preparation | Power Query (M language), strong ETL built into the tool | Tableau Prep, separate tool, good for complex data shaping |
| Data modeling | Strong; DAX, semantic models, relationships across tables | Limited; Tableau’s data model is less robust for complex joins |
| Visualization | Good; solid standard library, custom visuals via marketplace | Excellent; wider native chart types, more visual flexibility |
| Dashboard development | Fast. Power BI Service enables quick publishing and sharing | More effort; richer options but longer build time |
| Advanced analytics | R and Python integration, AI visuals via Azure ML | R and Python integration, TabPy server, broader statistical flexibility |
| AI capabilities | Copilot (Microsoft Fabric required), Q&A, Key Influencers | Tableau Pulse (Einstein AI), Ask Data, Einstein Copilot |
| Integrations | Deep Microsoft stack, Azure, Teams, SharePoint, Excel, Dynamics | Strong Salesforce native integration, broad connector library |
| Collaboration | Native Microsoft Teams integration, comment threads in reports | Server and Cloud sharing, Slack integration, Pulse subscriptions |
| Security | Row-level security, Azure AD integration, Microsoft Entra | Row-level security, User Attribute Functions, SAML/OIDC/SCIM |
| Governance | Microsoft Purview integration, sensitivity labels, deployment pipelines | Tableau Catalog, certified sources, lineage tracking |
| Scalability | Microsoft Fabric handles enterprise-scale with capacity licensing | Tableau Server scales on-prem or cloud infrastructure dependent |
| Customization | Custom visuals via AppSource, limited report canvas options | More layout flexibility, pixel-perfect dashboard control |
| Mobile experience | Power BI Mobile app, optimized layouts available | Tableau Mobile; responsive views, offline snapshot support |
| Enterprise deployment | Microsoft Fabric, deployment pipelines, managed via Azure | Tableau Server (self-managed) or Tableau Cloud (SaaS) |
| Platform dependency | Requires Windows for desktop authoring | Windows and macOS support |
| Pros | Cost-effective, Microsoft ecosystem depth, governed reporting | Visual flexibility, Mac support, strong analyst exploration |
| Cons | Windows-only desktop, complex DAX for advanced models | Higher cost, less Microsoft integration |
Source: Gartner
Power BI vs Tableau Pricing: Which One Fits Your Budget?
Power BI pricing
| License | Cost | What It Includes |
| Power BI Free | $0 | Individual desktop access, no sharing |
| Power BI Pro | $14/user/month | Report sharing, collaboration, 10 GB storage |
| Power BI Premium Per User | $24/user/month | AI features, larger datasets, paginated reports |
| Microsoft Fabric | Capacity-based | Unified platform; Power BI, Synapse, Data Factory |
Power BI Pro is included at no extra cost for Microsoft 365 E5 subscribers. Need role-specific dashboards built on Power BI? Our Power BI dashboard development team covers executive, operational, and analytical views.
Tableau pricing
| License | Cost | What It Includes |
| Tableau Creator | $75/user/month | Full authoring, Tableau Desktop, Tableau Prep |
| Tableau Explorer | $42/user/month | Self-service analytics, no data source creation |
| Tableau Viewer | $15 to $20/user/month | Dashboard viewing and filtering only |
| Tableau+ | Custom pricing | AI-powered analytics, Einstein Copilot |
The Creator license gap of $75 vs $14 costs a 100-person analytics team over $73,000 annually in license costs alone. If you’re looking to get more from your Tableau investment, our Tableau development services team can help with workbook development, Server and Cloud architecture, and Tableau Prep pipeline design.
1. Tableau Self-Service Analytics Guide
2. Tableau Server New Features 2026
3. AI and Tableau
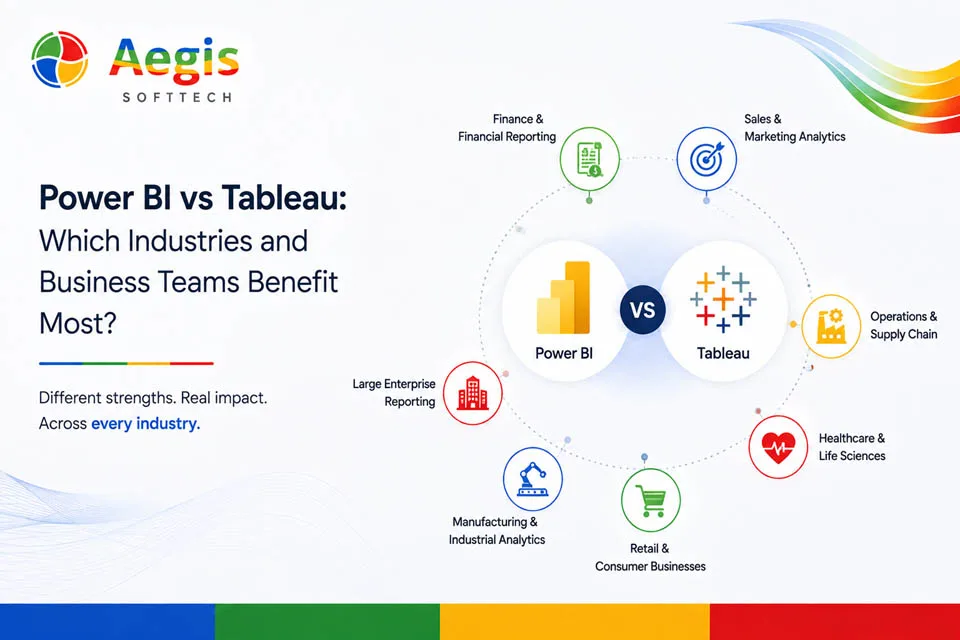
Power BI vs Tableau: Which Industries and Business Teams Benefit Most?
Finance and Financial Reporting
Power BI has connectors to Microsoft Dynamics 365, Excel, and the Azure SQL stack that most finance teams currently have up and running. Power BI paginated reports are a special type of report designed to provide regulatory-style tabular output for use in audit trails and statutory reporting.
Sales and Marketing Analytics
Tableau’s Salesforce integration is native and deep. For organizations where Salesforce is the revenue system of record, Tableau reads Salesforce objects directly. Power BI connects to Salesforce too but requires more configuration.
Operations and Supply Chain
DirectQuery in Power BI, alongside its Azure SQL and IoT Hub integrations, comes into play for operational monitoring in use cases that require real-time analysis. One Aegis manufacturing client saw a 40% reduction in operational delays after Power BI deployment.
Healthcare and Life Sciences
Power BI with Azure Health Data Services natively handles HL7 FHIR data. Aegis’ Tableau healthcare case study showed a 40% improvement in resource allocation for a hospital network.
Retail and Consumer Businesses
Power BI AI features, Key Influencers, Decomposition Trees, and Copilot work well for customer behavior analysis. Tableau’s visual flexibility supports complex basket analysis and geographic sales mapping.
Manufacturing and Industrial Analytics
Power BI integrates with Azure IoT Hub, Azure Synapse, and most operational databases used in manufacturing environments. Our Power BI Direct Lake Mode and Power BI Dataflow Processing in Azure guides cover performance optimization for manufacturing data environments.
Large Enterprise Reporting
Enterprise business intelligence at scale needs certified data sources, semantic consistency, role-based access controls, and version-controlled deployment pipelines. Both platforms deliver this. The right choice depends on which technology ecosystem the enterprise already runs. Hire Power BI Developers from us if you’re looking for certified talent embedded directly into your BI program.
Source: Gartner
Microsoft Power BI vs Tableau: Which is Better for Your Business
Both tools perform admirably, but they occupy separate primary use cases. Organizations that choose the wrong fit may deal with that mismatch for years.
➡ Choose Power BI if:
- Your organization runs on Microsoft 365, Azure, or Dynamics 365
- Cost efficiency is a priority, especially for large viewer populations
- You need governed, standardized reporting across the enterprise
- Your data team is more comfortable with Excel and SQL
- You want AI features without additional platform investment
➡ Choose Tableau if:
- Your organization runs Salesforce as its primary CRM
- Your analytics team performs complex exploratory analysis regularly
- You have Mac users who need desktop authoring capability
- Your data volumes push into billions of rows
- Visual customization and interactive storytelling are primary requirements
➡ Consider both if:
Some large enterprises use Power BI for standardized reporting and Tableau for analyst exploration. By using this dual-system architecture, you add licensing cost but eliminate the trade-off between governance and depth of analysis.
Whichever direction you go, having the right implementation partner makes the difference. Our Tableau consulting services team supports governance design, platform migration, and Tableau Next AI adoption for organizations making the switch or scaling up.
How Aegis Softtech Can Support Power BI and Tableau Implementation
Choosing the platform is only the first step. It is the implementation that makes the investment pay off. The result is determined by data architecture, semantic modeling, governance design, model training, and long-term support.
Aegis Softtech has 15+ years of BI delivery experience across Power BI and Tableau, having been part of organizations’ journeys towards successful implementations, platform selection and migration from legacy tools, performance optimizations, certified data source governance, and long-term managed support.
Our Power BI consulting services cover BI strategy and semantic model architecture. Both companies follow ISO 27001-certified practices. They serve clients in the US, UK, Asia-Pacific, Europe, and Latin America. We make sure our work fits your time zone and project size. We do not make you change your schedule to fit us.
FAQs
Q. Is Power BI better than Tableau?
A. Depends entirely on context. Microsoft-stack organizations get governed reporting at a fraction of Tableau’s cost with Power BI. However, Tableau suits Salesforce-centric teams needing visual depth. Moreover, both are 2026 Gartner Leaders.
Q. How easy is it to use Tableau compared to Power BI?
A. Power BI has the shorter ramp, especially for anyone already using Excel. It requires little to no programming knowledge for basic report building. Tableau’s drag-and-drop works well too, but LOD expressions and Server administration take considerably longer to get comfortable with.
Q. Which is more suitable for enterprise business intelligence?
A. Both are enterprise-grade. Power BI suits Microsoft infrastructure enterprises that use Microsoft Fabric for unified governance. However, Tableau suits mixed-stack enterprises needing a visualization layer independent of the underlying data platform.
Q. Which has better data visualization capabilities?
A. Tableau has a wider native chart library and more layout flexibility. On the other hand, Power BI covers most standard needs, with additional chart types available through AppSource. Tableau leads for complex visual storytelling.
Q. Is Power BI cheaper than Tableau?
A. Yes. Power BI Pro costs $14/user/month. Tableau Creator costs $75/user/month. If your company already uses Microsoft 365 E5, you get Power BI Pro for free. For companies, the yearly cost difference between Power BI and Tableau is huge.
Q. Which performs better with large datasets?
A. Power BI and Tableau perform depending on how much data you have. The Hyper engine in Tableau is great at handling extracts with billions of rows. Power BI works well with up to a few hundred million rows in import mode. If you have large amounts of data in memory, Tableau has a clear edge.
Q. Can Tableau and Power BI leverage AI in business analytics?
A. Yes. Both tools can. Power BI comes with Copilot, Q&A, Key Influencers, and Azure ML connectivity. Tableau offers Ask Data, Pulse, Tableau Agent and Python/R through TabPy. Because of this, AI is no longer a deciding factor. Both Power BI and Tableau treat AI as a feature.
Q. Which platform is better for data modeling?
A. Power BI is better for data modeling. The semantic model and DAX combination handles complex multi-table relationships, time intelligence calculations, and reusable, centrally governed measures better than Tableau’s workbook-based calculation approach.
Q. Can Tableau and Power BI leverage AI in business analytics?
A. Yes. Both do. Power BI includes Copilot, Key Influencers, Q&A, and Azure ML connectivity. Tableau brings Pulse, Ask Data, Tableau Agent, and Python/R through TabPy. Hence, AI is no longer a differentiator; both treat it as standard.
Q. Should a business use both Power BI and Tableau?
A. Some large companies do exactly that. These companies use Power BI for reports and use Tableau when analysts need to dig deep into the data. Two platforms mean two license bills and two governance frameworks to manage. Worth it for large enterprises where neither tool alone covers every use case.