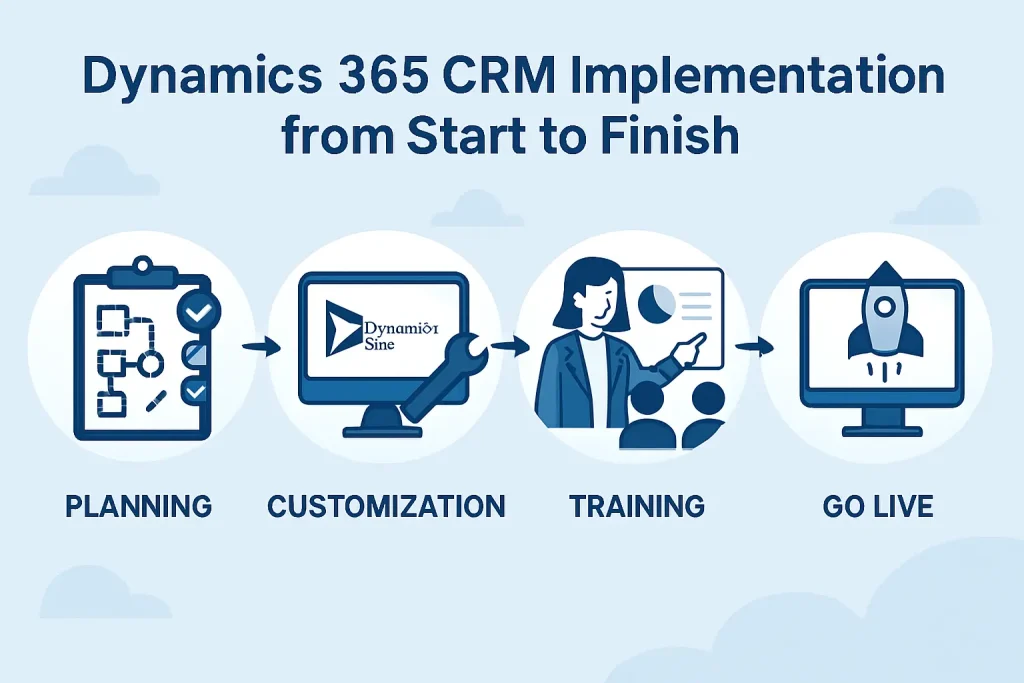

A CRM dashboard is a single screen that shows your sales, marketing, and customer data together. No more opening five tabs to find one number. In this article, we’ll go over what it does, why people use one, some real examples, and which tools are worth trying.
Key Takeaways
- The CRM dashboard is a collection of data related to sales, marketing, and customers.
- The dashboard helps track the KPIs and trends in real time.
- There are separate dashboards for different departments like sales, marketing, and support.
- Almost all CRM solutions come with the facility of a dashboard where you can get real-time reports.
- A good dashboard will concentrate on the metrics that you use.
What Is a CRM Dashboard?
A CRM dashboard captures data from your CRM system and turns this data into charts and numbers that can be read easily. It displays all sales, leads, and customer activity on one screen. Most modern CRM platforms, including Microsoft Dynamics 365 CRM, provide built-in dashboard tools that help sales, marketing, and customer service teams monitor business performance in real time. Unlike spreadsheets, CRM dashboards update automatically with the change in your customer and sales data. This gives teams real-time visibility into business performance.
For instance, consider the dashboard in your vehicle. There is no need for you to be aware of what happens inside the engine. All you have to do is look at the dashboard, and you’ll know whether everything is working well or not.
Who Should Use a CRM Dashboard?
The CRM dashboard can help almost all teams that interact with the customer base. These include:
- Sales teams track deals and revenue.
- Marketing teams monitor campaign performance.
- Customer support teams keep an eye on response times.
- Business owners get a quick overview of company performance without digging through reports.
Benefits of a CRM Dashboard
CRM dashboard benefits include faster decision-making, better personalization, and team alignment, among others. These show up fast once your team starts using one. Less time hunting for numbers. Fewer arguments about whose data is right. And you make decisions quicker, because you’re not waiting on someone else’s report.
| CRM dashboard benefits | What it means |
| Faster decisions | Real numbers, right now. Not a report from last week |
| Better personalization | You see a customer’s history before you even call them |
| Stronger retention | You catch an unhappy customer before they leave |
| Team alignment | Sales, marketing, support. Everyone’s looking at the same thing |
| Less manual work | No more copying numbers from one spreadsheet to another |
Key Features of a CRM Dashboard Tool
With a CRM dashboard tool, you can get instant insights using customizable dashboards, sales pipeline monitoring, customer analysis, task management, reports, and KPI monitoring all within one central interface. Below are some key CRM dashboard features you should know about.
- Scalability: There should not be any lag in performance even as your data increases in size.
- Interactivity: Click a number, see what’s behind it. That’s interactive data visualization, basically.
- AI help: Type a question in plain English. Get an answer. No query writing.
- Customization: You can drag things around yourself. Nobody needs to call a developer.
- Role-based views: Representatives see their own stuff. Managers see the team. Executives just get the summary.
- Mobile access: You can access your CRM dashboard using your mobile phone to monitor sales and customer activities even when you’re travelling.
- Real-time data: Your data will be updated automatically in real-time, depending on any activity related to your customer’s activities or transactions.
Common CRM Dashboard KPIs
Some of the most common key performance indicators that businesses measure using CRM dashboards are sales performance, marketing effectiveness, customer service, and customer retention. Below is a list of the most common KPIs used in any CRM dashboard.
| KPI | Why Does It Matter? |
| Revenue | Shows sales growth |
| Pipeline value | Measures future revenue |
| Win rate | Shows sales effectiveness |
| Conversion rate | Tracks marketing success |
| Response time | Measures customer service |
| Customer retention | Indicates customer loyalty |
| Cost per lead | Shows marketing efficiency |
CRM Dashboard Examples
The best CRM dashboard depends on your role and business goals. Here are four popular CRM dashboard examples that help businesses track key metrics and make faster decisions.
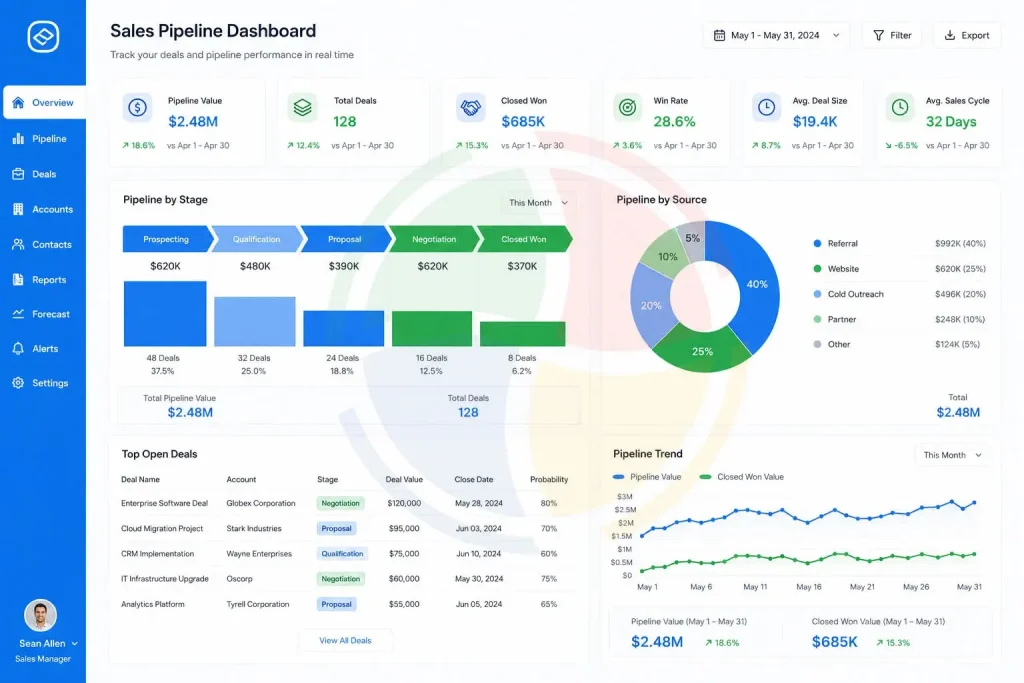
1. Sales Pipeline Dashboard
A sales pipeline dashboard shows every deal you’ve got, from first contact to closed. Sales leaders use it to catch stuck deals early, not after the quarter’s basically over. The key metrics it tracks are:
- Sales opportunities: The prospective customers interested in buying something.
- Pipeline value: The total amount of money in the pipeline at the moment.
- Sales cycle length: The time taken to convert a prospect into a customer.
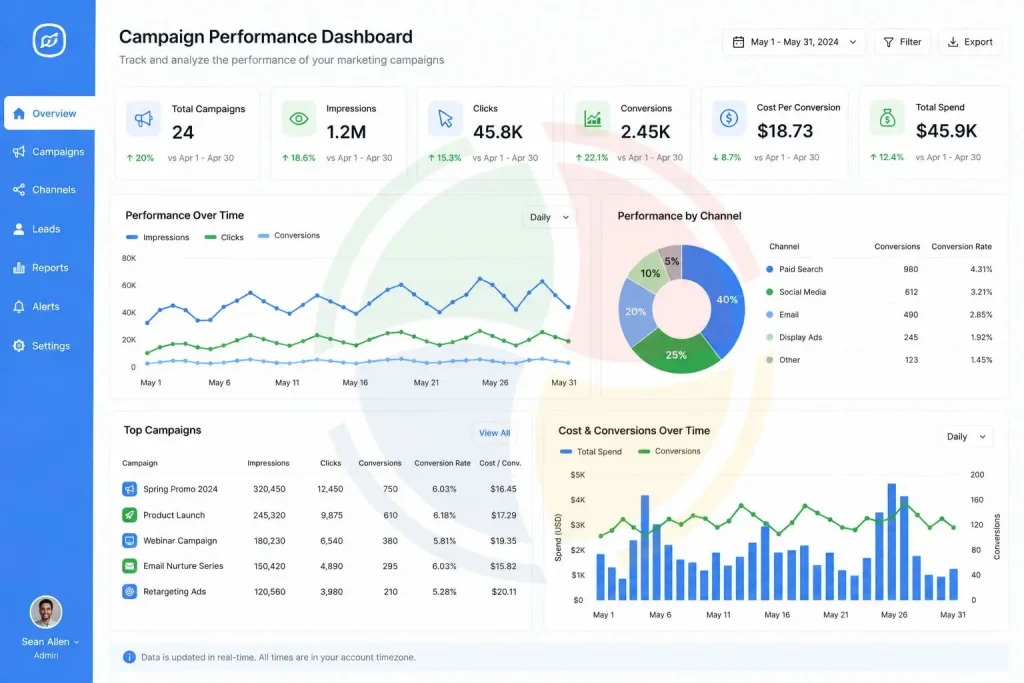
2. Campaign Performance Dashboard
A campaign performance dashboard puts all your ad and content numbers in one spot. Marketing doesn’t have to log into five platforms just to see how a campaign did. You can use this dashboard to track:
- Click-through rate (CTR): Clicks divided by the number of views.
- Cost per acquisition (CPA): Costs for acquiring one customer.
- Conversion rate: The percentage of visitors performing your desired action.
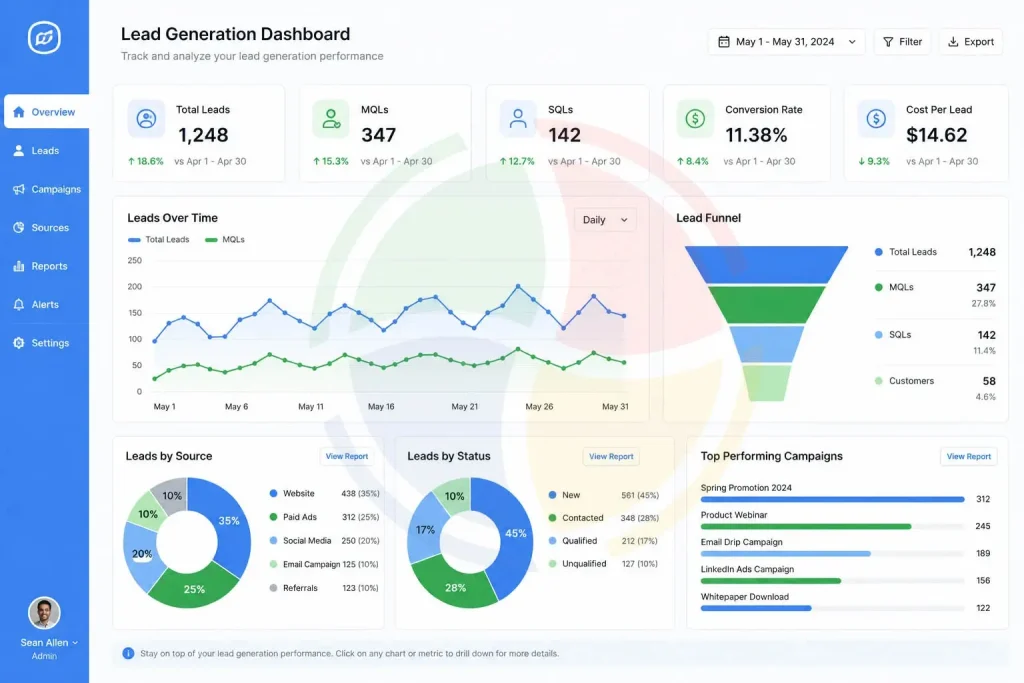
3. Lead Generation Dashboard
A lead generation dashboard tracks how many strangers turn into actual leads. It’s the link between your ad spend and real sales conversations. You can track the following metrics using lead generation dashboard:
- Marketing qualified leads (MQLs): Those who have genuinely expressed interest..
- Sales qualified leads (SQLs): These leads have been reviewed and forwarded to the sales team.
- Cost per lead: Amount of money being spent to obtain one lead.
4. Activities Dashboard
An activities dashboard tracks what representatives are doing all day. Calls, emails, meetings, follow-ups. It’s not really about results. It’s about effort, and whether people are keeping up. Track the following KPIs with this dashboard:
- Calls made per representative: How many outbound calls in a given week.
- Meetings scheduled: New meetings booked by the team, plain and simple.
- Response time: Speed at which a response is made after a customer contacts you.
In most cases, organizations will find themselves having to run several of the above at once. A sales pipeline dashboard for the representatives. A campaign performance dashboard for marketing. A lead generation dashboard for the top of the funnel. And an activities dashboard just to keep everyone honest.
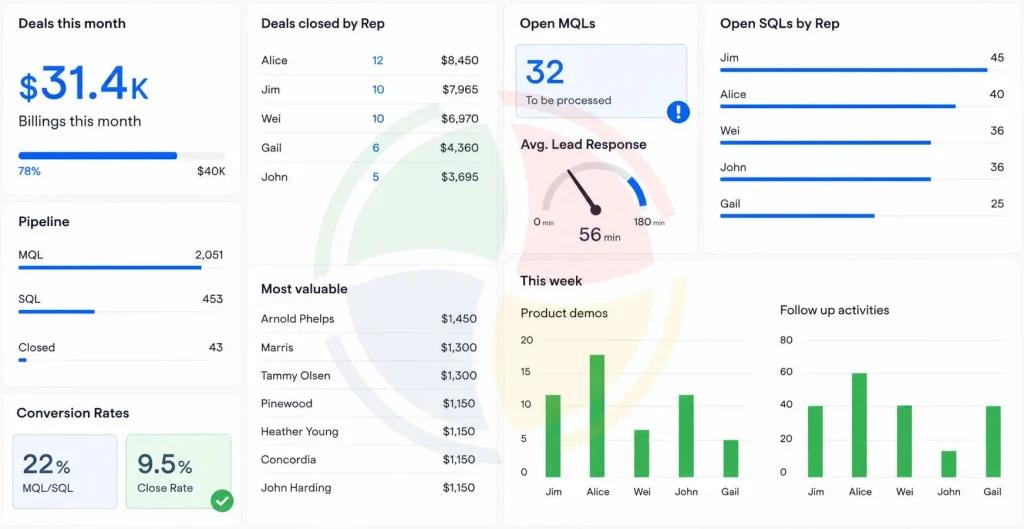
Popular Dashboard Tools to Consider
Most CRMs already come with dashboard tools built in. Which one works best for you really depends on your data and how comfortable your team is with tech.
| Tool | Best for |
| Microsoft Dynamics 365 CRM | Custom workflows, Microsoft ecosystem integration, and medium to large businesses |
| Salesforce | Deep customization, good for a sales pipeline dashboard, bigger teams |
| HubSpot | Quick setup, drag-and-drop reports, smaller teams |
| Zoho CRM | Cheaper option for businesses still growing |
| Power BI | Interactive business reporting, Microsoft data integration, and executive dashboards |
| Tableau | Advanced data visualization, complex analytics, and combining data from multiple sources |
How to Create a CRM Dashboard in 5 Steps
Don’t worry about having to have a data team for this. The reality is that all of us can design a workable dashboard within an afternoon. All that you need to do is adhere to the following steps without much deliberation.
Step 1: Set your objective
Start by determining what the purpose of your dashboard is. Will it be for sales, marketing, or customer service teams? This helps you concentrate on the necessary metrics.
Step 2: Select your KPIs
Pick up 5 to 8 key performance indicators (KPIs) that support your business objectives. Don’t overcrowd your dashboard with all possible metrics. Only monitor the data that your team will base their decisions upon.
Step 3: Select your dashboard tool
Choose a CRM or dashboard platform that integrates with your business applications and matches your team’s needs. Solutions like Microsoft Dynamics 365 CRM, Salesforce, and HubSpot include built-in dashboard and reporting features that help track business performance in real time.
Step 4: Make Your Dashboard
Design your dashboard in such a way that it makes your key metrics more prominent. Use good visuals and segment your dashboard into logical segments by eliminating unnecessary reports and widgets.
Step 5: Monthly Review
Review the dashboard on a monthly basis to ensure that the metrics still correspond to your goals. If there have been changes in your priorities, change your KPIs and visuals correspondingly.
Conclusion
A CRM dashboard isn’t just another report. It’s the place your team goes every day to understand what’s happening with customers, sales, and marketing. Once a company concentrates on the appropriate KPIs, it will be able to identify issues and make better decisions.
A well-designed CRM dashboard gives your team the insights they need to make faster, data-driven decisions. At Aegis Softtech, we help businesses implement Microsoft Dynamics 365 CRM, build custom dashboards, and integrate Power BI to provide complete visibility across sales, marketing, and customer service.
Frequently Asked Questions
What is a CRM Dashboard?
CRM dashboard is a user interface that brings together all your important information regarding sales, marketing, and customer management into one place.
How can I make a CRM Dashboard?
Steps involved in making a CRM dashboard are: setting the purpose, picking appropriate measures, associating with appropriate data, designing an easy layout, and reviewing it.
Why is a CRM dashboard critical?
A CRM dashboard is critical for your business, as it brings all your critical sales, marketing, and customer information under one roof.
Can Excel be used as a CRM dashboard?
Indeed, Excel can act as a simple dashboard for CRM with visualizations in the form of charts and tables. But Excel doesn’t provide real-time data, automation, and interactivity available in other software products designed specifically for creating CRM dashboards.
What is the difference between a CRM dashboard and a CRM report?
A dashboard provides real-time information enabling you to make quick decisions. A report is rather a static piece of writing reflecting data from a certain time period.
What KPIs should be featured in a CRM dashboard?
Pipeline value, conversion rate, lead source, time to respond, and retention are some of them. However, it’s preferable to highlight a few KPIs only.
Which CRM provides the best dashboard?
Both Salesforce and HubSpot offer well-designed dashboards that come with CRM packages. The choice depends on the number of users and the existing infrastructure.
Can I create a CRM dashboard without coding?
Yes, all modern CRM dashboard tools provide drag-and-drop builders, so no technical skills are required.
How often should a CRM dashboard be updated?
The data itself should update daily or in real time. The layout and the KPIs you’re tracking are worth a second look once a month.
Is a CRM dashboard the same as a BI dashboard?
Not really. A CRM dashboard sticks to customer and sales data. A BI dashboard can pull in numbers from the entire business.