
- Install NodeJS
- Install VS Code
- Install VS Code Extension for debugging
Do you know that we can debug angular applications from Visual studio code? Now, say goodbye to manual debugger that we used to put in Typescript code wherever we wanted to break the application. Now you can easily achieve the same by just putting a breakpoint on the line which you want to hit the debugger.
Agenda: The agenda of this tutorial is to understand the asp.net web development features of Visual Studio Code that allows debugging of angular application just like C# debugging. We will achieve this by installing an extension in VS Code from Extensions library.
First of all, we need to install the pre-requisites.
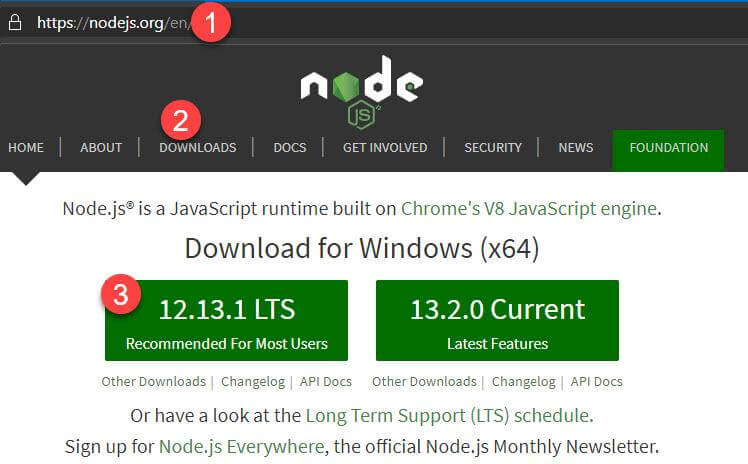
Downloading and installing NodeJS:
Go to Https://nodejs.org and follow the steps shown in the screenshot below.
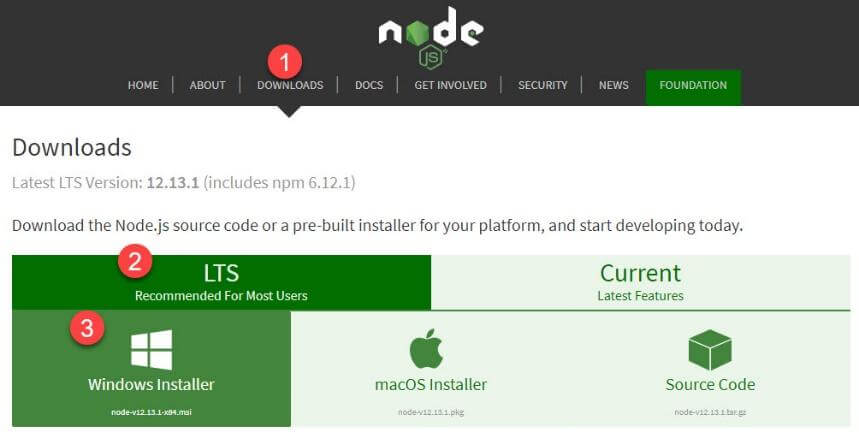
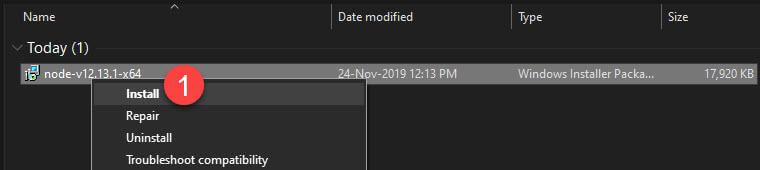
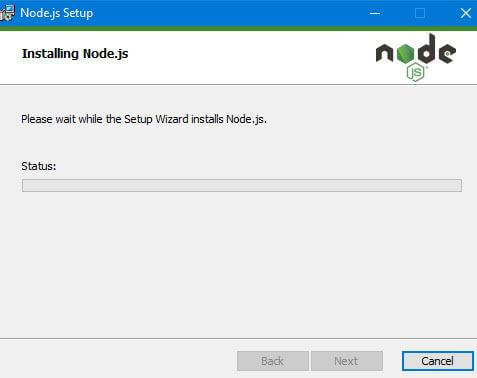
Go to the folder, where the above file is downloaded and install the msi.
Installing VS Code
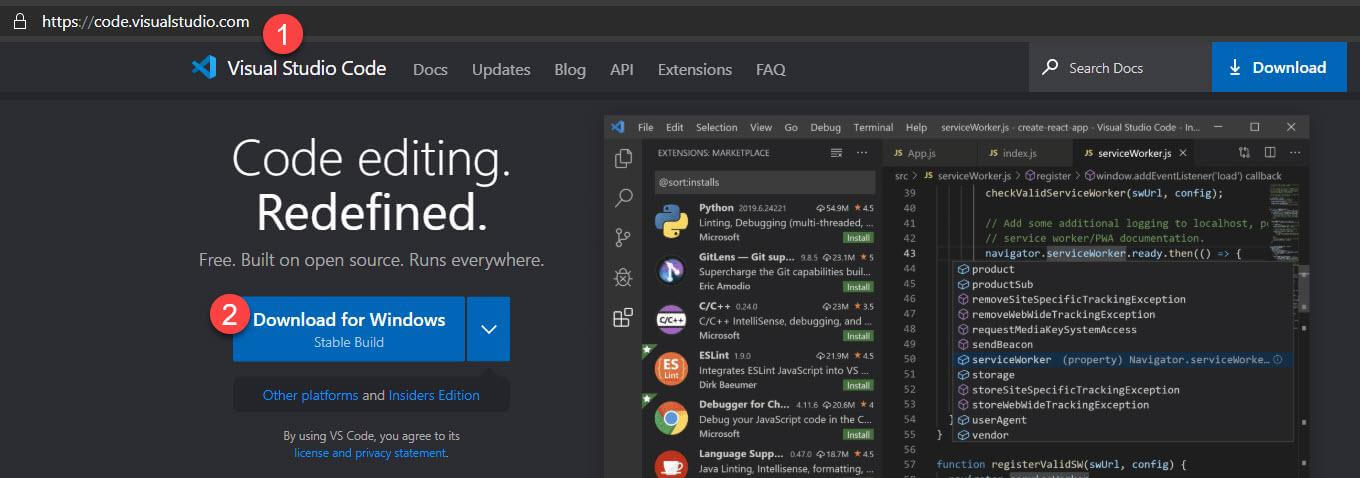
Go to https://code.visualstudio.com/ and follow the instructions shown in screenshots below:
Installing VS Code Extension for Debugging
The extension is available in Extensions library in VS code and we just need to download it.
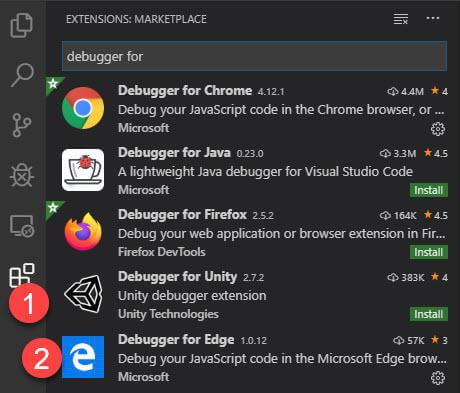
As you can see in the screenshot, debugger is available for almost all common browsers used by developers. Most common are Edge and Chrome. We will install Debugger for Edge extension for this example.
Now, we are ready for Angular app.
Facing shortage of time and techies
Debugging angular applications is a tricky process. We specialize in debugging angular applications from Visual studio code by installing VS code from extensions library.
Let’s create an Angular Demo application using Angular CLI.
Step 1: Create a folder where you want to create the application. In my case, I have created a folder in C drive.
Step 2: Follow the commands below to create an Angular application using Angular CLI. Open Terminal in VS Code.
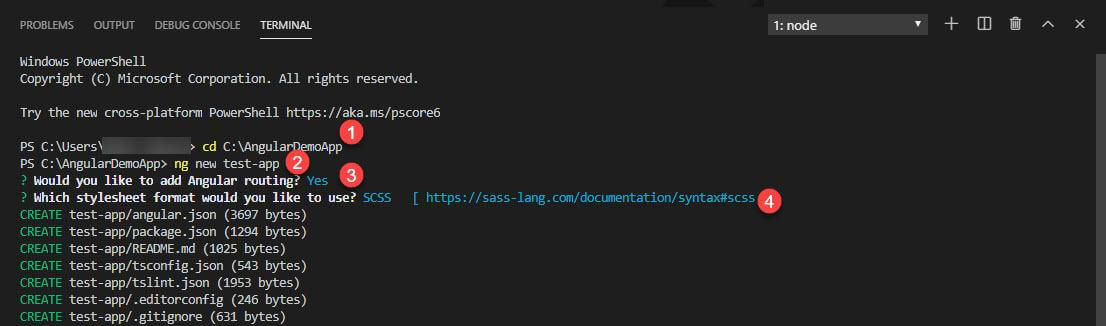
Command 1: will change the current directory to the project directory. In our case, it is C Drive and folder name.
Command 2: will create a boilerplate template code using “ng” which is Angular CLI.
Some people might get an error at this point as you have to sometimes install Angular CLI. To Install Angular CLI, just type the following command.
Once you install Angular CLI, then hit the Command 2 in screenshot and it will automatically ask you to select some configuration options for template. You can select based on your needs, I selected what you see in Command 3 and 4.
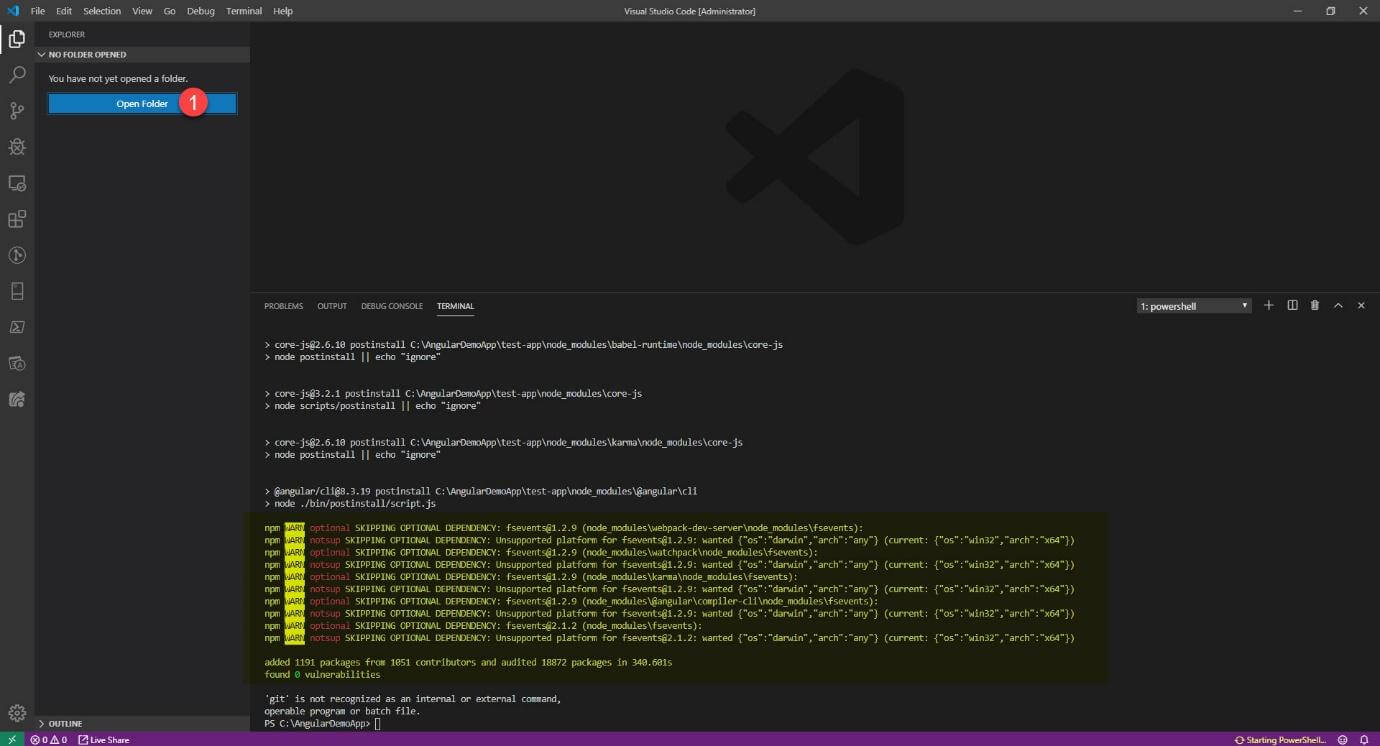
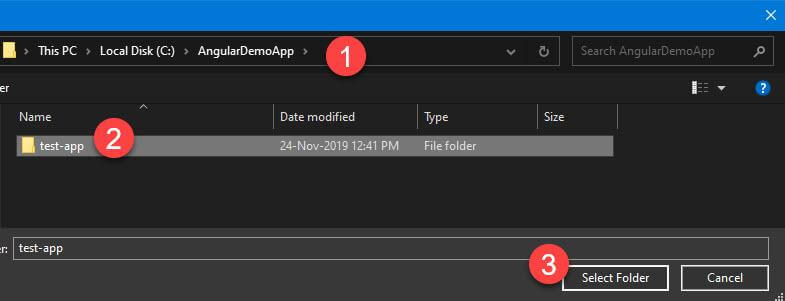
Step 3: Since our angular app is created, we need to open that project folder in VS Code. Please look at the screenshot below.
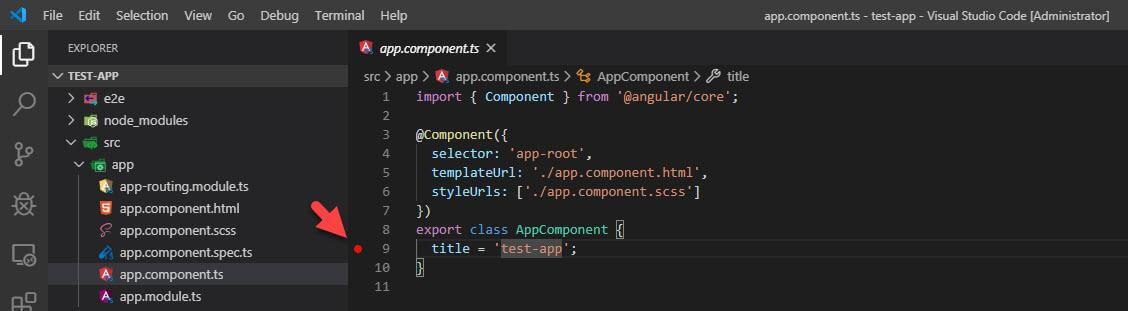
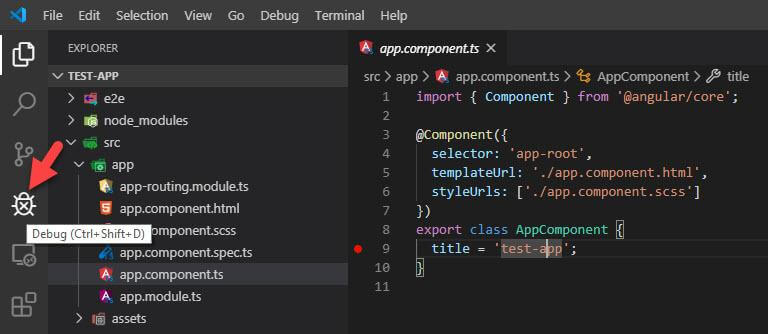
Step 4: Go to app.component.ts file and put a breakpoint at the line shown below.
Step 5: Since we have put a breakpoint at the starting point of application, debugger should hit this breakpoint. For that we need to create a debug configuration in Debug window of VS Code.
So, click on little icon on left to enter VS Code Debug window.
Step 6: Now, we have to create a configuration for our application to enable debugging with Microsoft Edge browser. There is a little configuration icon on top left, lets click on it.
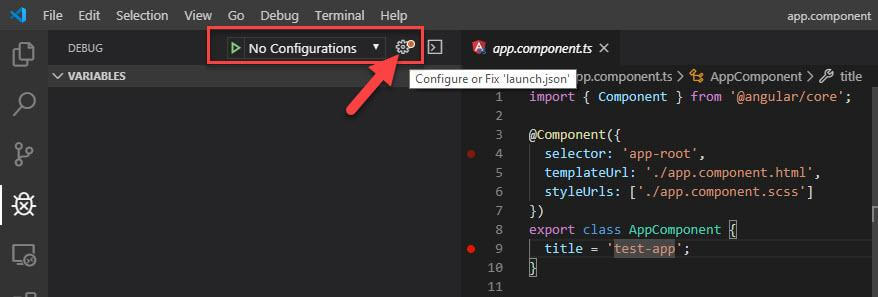
Once you click this little icon, it will create a launch.json file in your project directory.
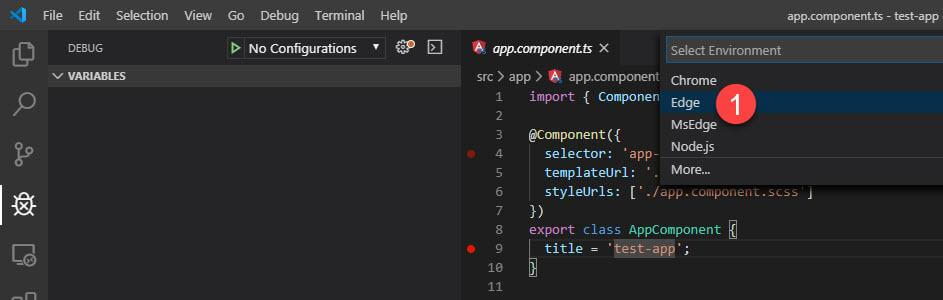
Now, select “Edge” from the dropdown. If you want to debug using Chrome, you have to install “Debugger for Chrome” extension and click “Chrome” option from the same dropdown.
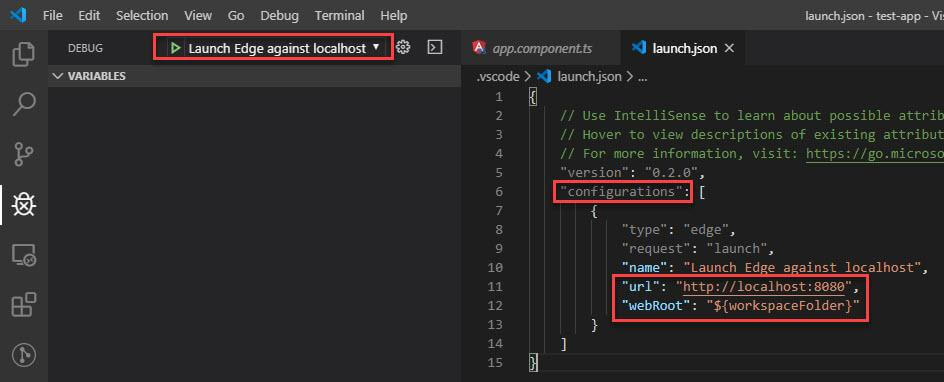
Look at the highlighted areas. On the left side, you can see a configuration to launch application with Edge against localhost. On right side, you have to define correct URL and Webroot folder of application.
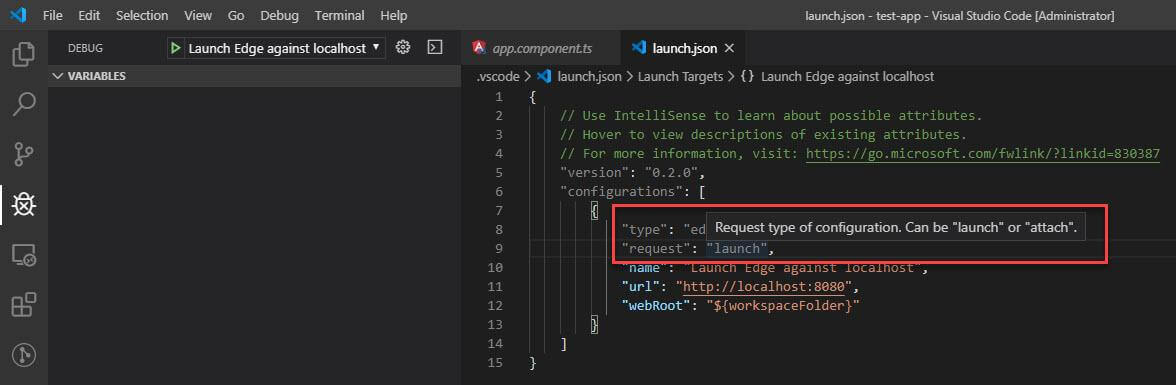
If you hover your mouse on the request variable, you will see that we have two options to select. One is “launch” and other is “attach”. Attach is used for debugging purpose and launch is used to run the application without debug.
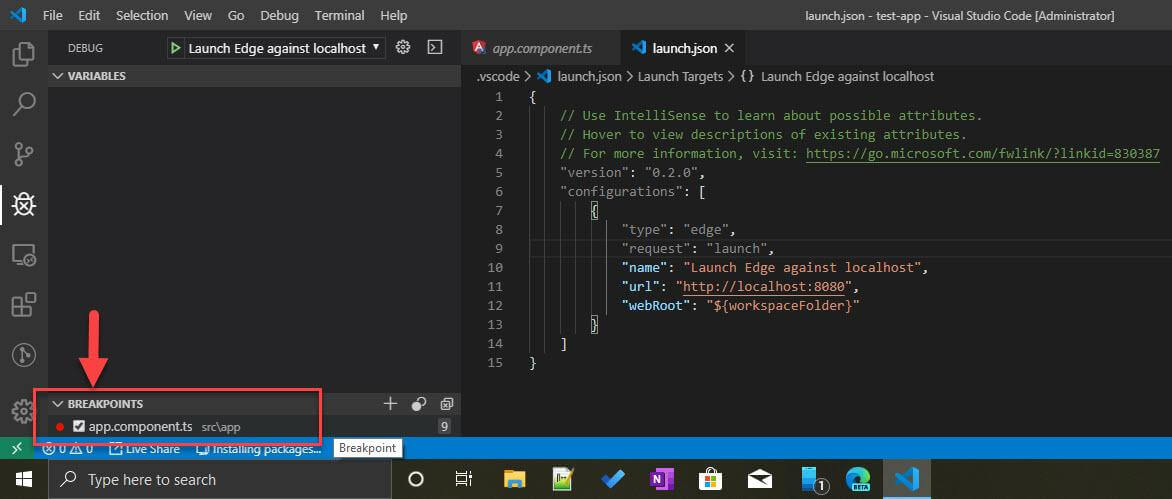
Step 7: Let’s launch the application and see if it hits the breakpoint in app.component.ts file.
You can see all the breakpoints that you have put within the whole project in Breakpoints tab.
To launch the application with debugger, you can click a little green button beside configuration name or simply press F5, just like we do in Visual Studio.
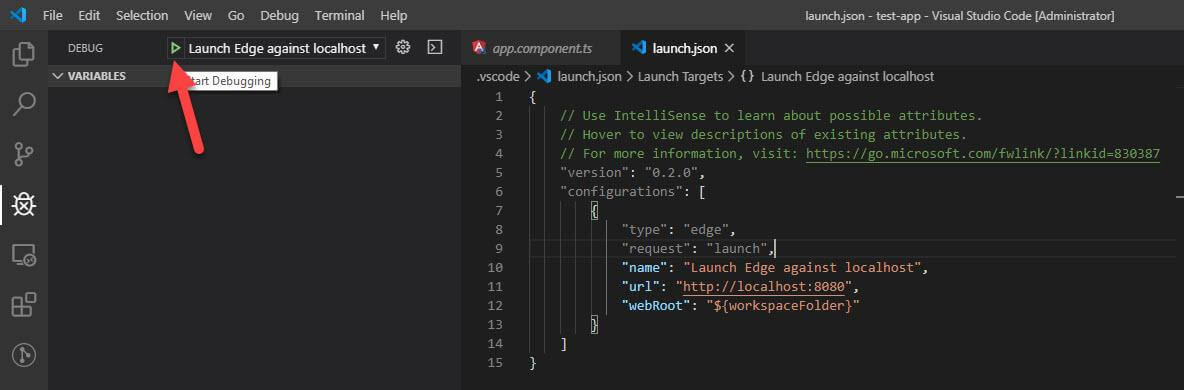
The above step will open browser with URL mentioned in launch.json configuration.
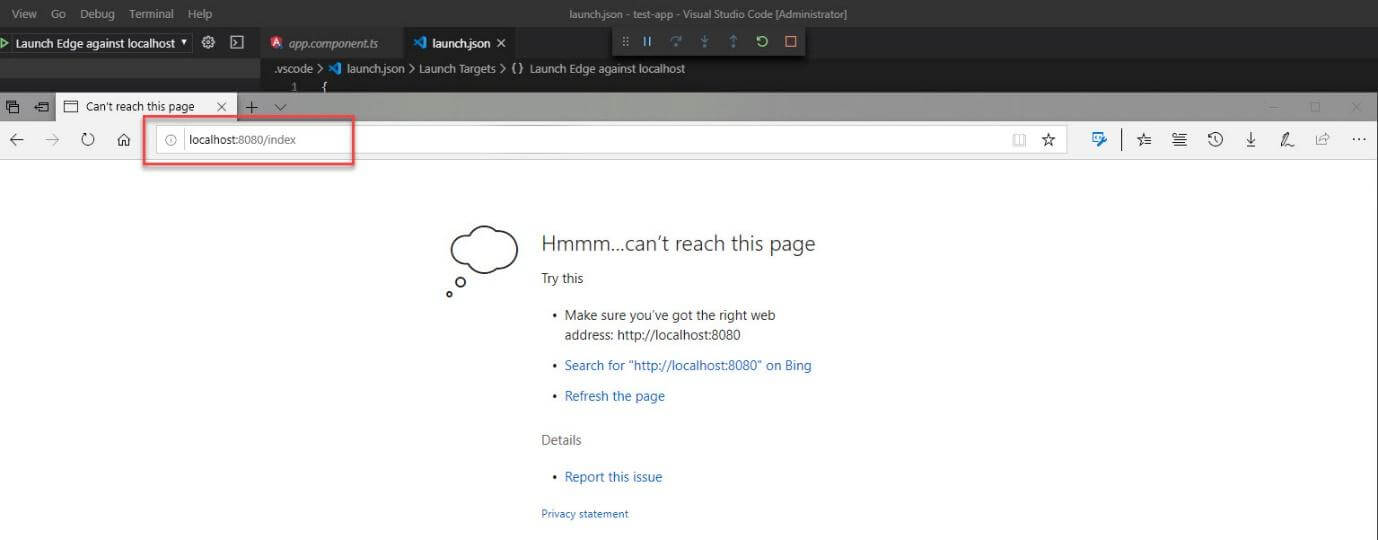
You can see that debugger didn’t hit the breakpoint. The reason behind that is, we have not build the application and start the NodeJs in the terminal.
Hit ‘ng serve’ command.
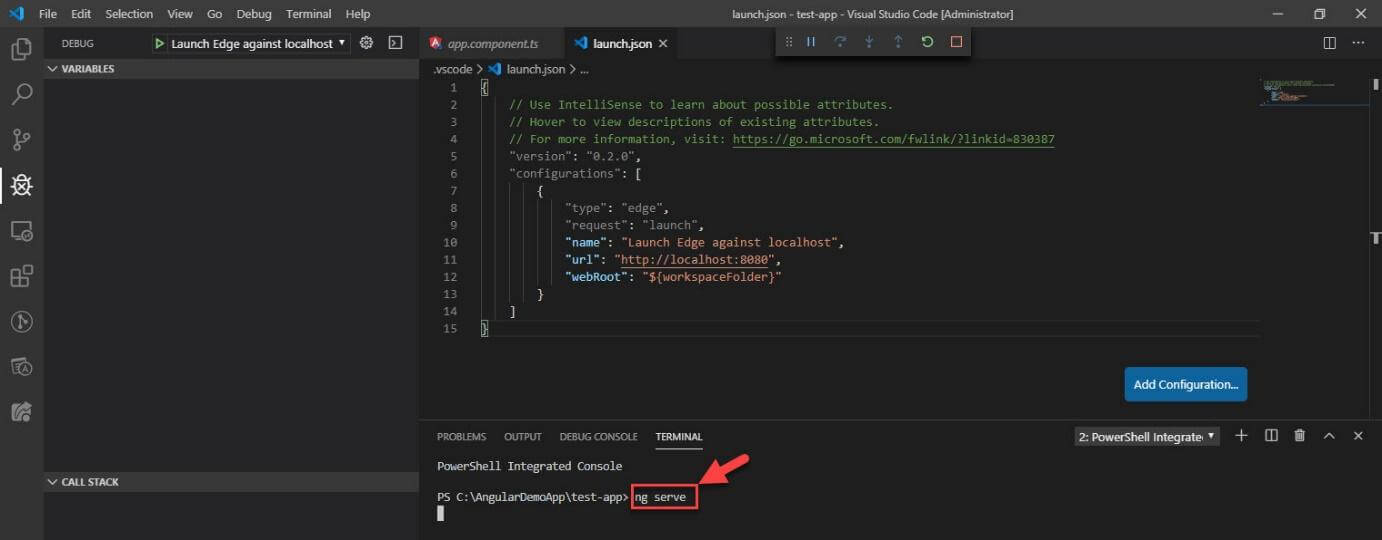
Once the above is completed, you will see the URL set by angular template in Terminal itself. Change the URL in launch.json file and then re-run the debugger.
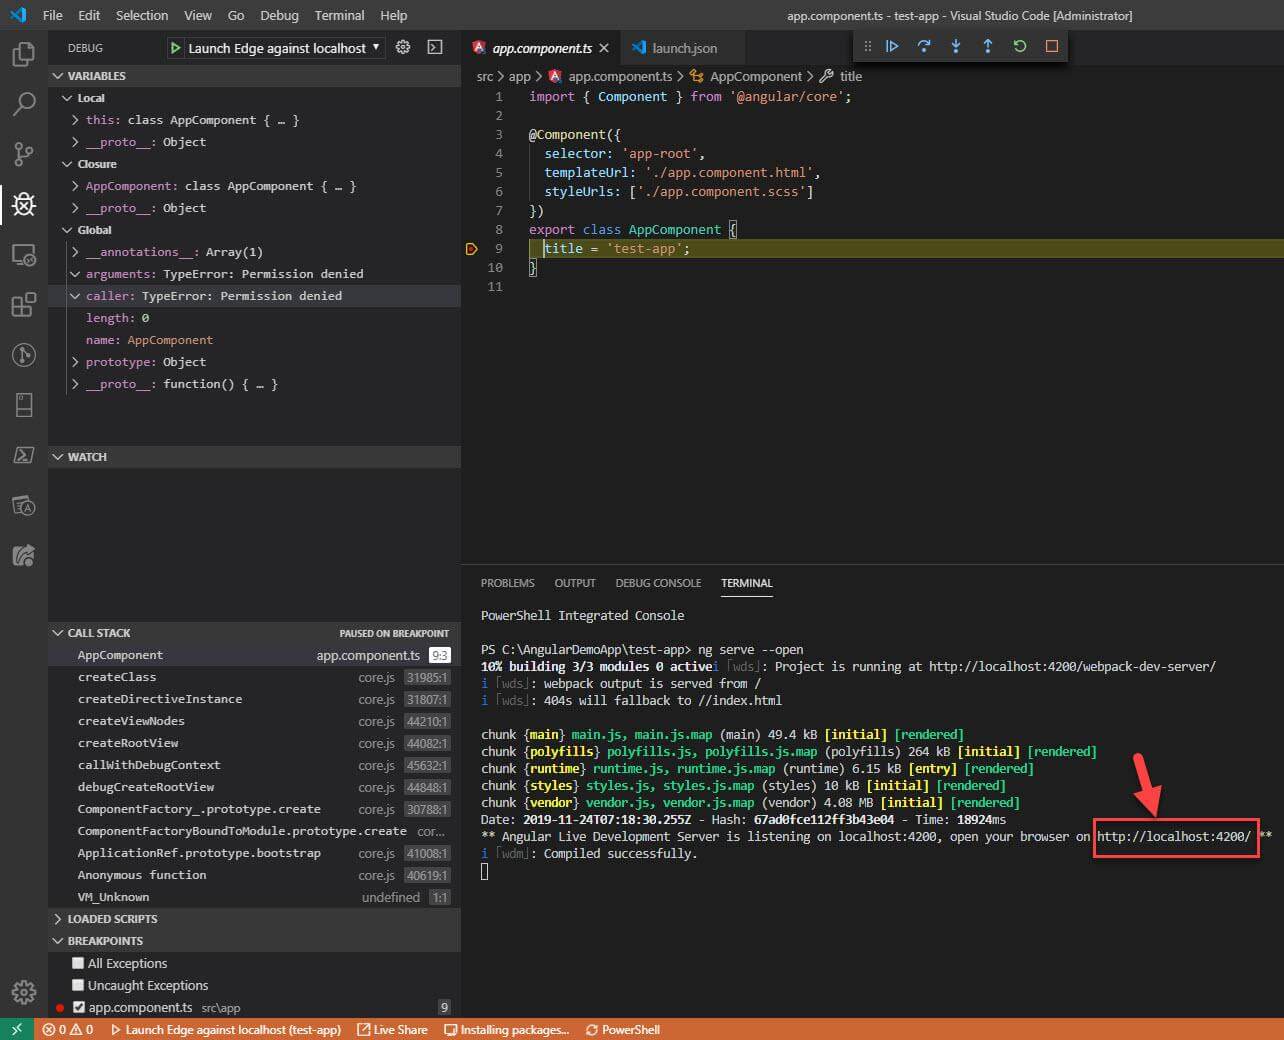
As you see, now debugger hits the breakpoint correctly. On the left pane, you can see the details of all the variables, constants, etc.
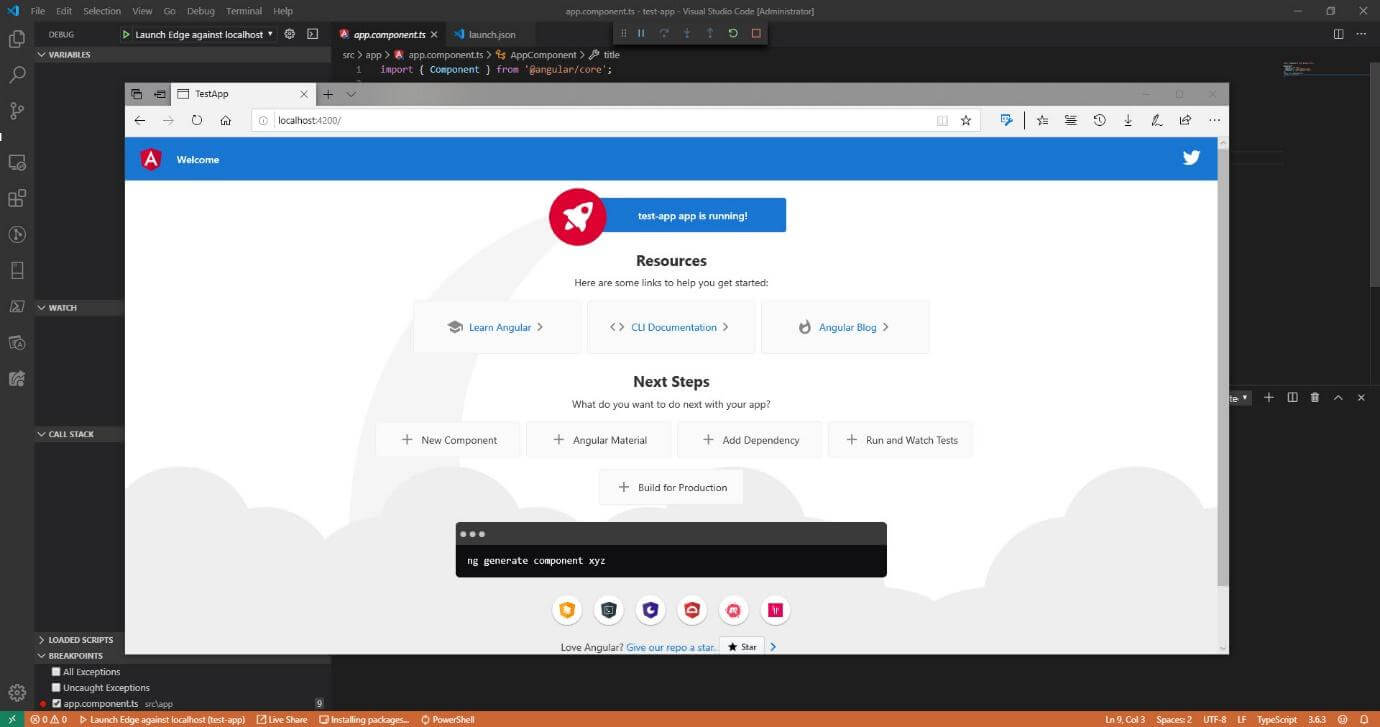
Once you hit continue in debug window, then the application page will load as shown below.
This is how, we can configure debugger in VS code and this is a one-time setup, so you don’t have to repeat it again and again.