

Why do we use LODs?
A visualization in Tableau financial and development services always has the same granularity as per the dimensions we are using in the particular visualization.
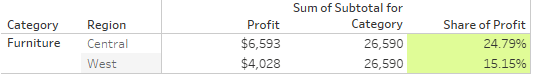
For an instance, When we use Category and Region in the below visualization, the values of measures like Profit and Sales get aggregated based on the category and region values.
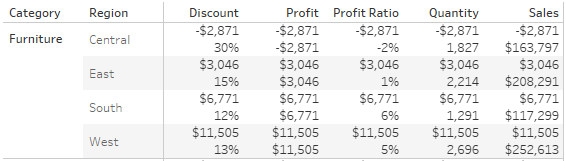
And that’s how it should basically work as the granularity depends on the details. But what if I want to see the ‘Share of Profit’ of a particular Region in the category and that too in the same visualization. Here the LOD expression comes handy.
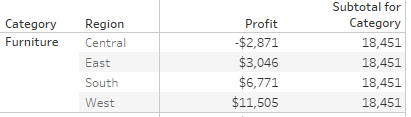
To get the ‘Share of Profit’ column we can use either FIXED or EXCLUDE expression. By using FIXED we can fix the granularity for the particular measure on Category column, now this will give us the total Profit for each category.
Subtotal for Category = {FIXED [Category]: SUM(Profit)}
Also by using EXCLUDE expression we can exclude the ‘Region’ column from granularity. Thus we can get the below results.
Subtotal for Category = {EXCLUDE [Region]: SUM(Profit)}
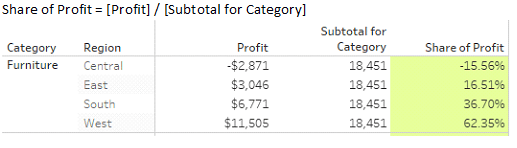
Now we can easily get the ‘Share of Profit’ of each region for the particular category by using below calculation:
Share of Profit = [Profit] / [Subtotal for Category]
What should we keep in mind while using LODs?
-
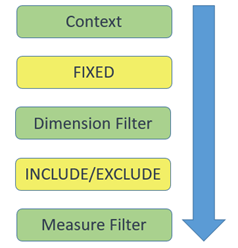
How the measure gets aggregated and filtered completely depends on the hierarchy of LODs and filters.
We will see with examples how does this hierarchy affects our calculations:
Scenario 1: Using Context and FIXED
Let's continue the above example for our understanding. We are using FIXED Lod for ‘Subtotal’ and ‘Share of Profit’ Column.
Approach us to acquire knowledge about designing the LOD (level of detail) expressions in the required statements.
What if we want to see only Region ‘East’ and ‘South’ in the visualization and the share should be divided between these 2 regions only. Lets create a filter on the region with ‘East’ and ‘South’ selected.
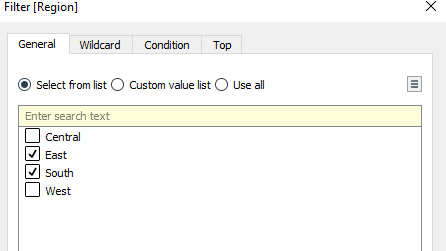
This is what we will get after applying the above filter.
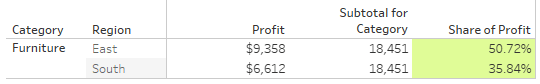
The filter was applied to the Profit column but not Subtotal and ‘Share of Profit’ column. Why did this happen?
Because in the hierarchy the region filter gets applied after the FIXED calculation. So the fixed calculation considers all the regions ignoring your region filter.
To avoid this, we can add the region filter to context and see the share getting divided among ‘East’ and ‘South’.
Scenario 2: Using Measure Filter and INCLUDE/EXCLUDE
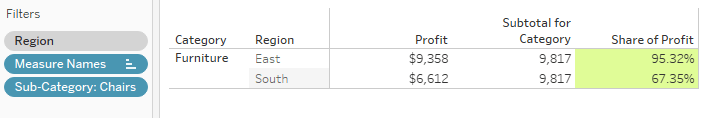
Lets continue with the same data. We are using EXCLUDE Lod for ‘Subtotal’ and ‘Share of Profit’ Column for this scenario. Now we have removed the region filter and instead we will apply the profit filter with maximum 660.
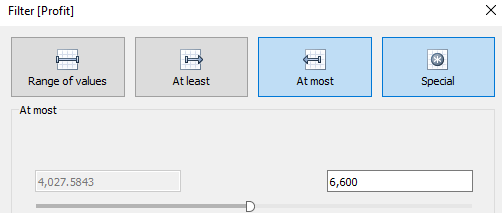
Again, my profit filter got applied on the Profit column but not on ‘Subtotal’ and ‘Share of Profit’ columns. Because the measure filter is below the INCLUDE/EXCLUDE LODs and won’t affect the LOD calculated fields.
This is how the Hierarchy affects our LOD calculations and we should always keep in mind this hierarchy while using LODs and filters.